


Understanding the Local Elections Projected National Share (PNS) in 2025

by John Curtice and Stephen Fisher, 1st May 2025.
One of the highlights of the BBC’s coverage of local elections is the Projected National Share (PNS). This is an estimate of what the GB share of the vote would have been if (a) local elections had been held everywhere, (b) the outcome where there were no elections mirrored the pattern where there were, and (c) the principal parties contested all the seats.
The aim is to provide a summary statistic that is comparable across local election years irrespective of the particular mix of places that have local elections in any particular year, a mix that varies considerably from year to year.
This year’s local elections, for example, take place primarily in rural shire county England. Most of them are places that vote Conservative in especially high numbers. In the general election last July, for example, the Conservatives were neck and neck with Labour rather than 11 points behind. They are also places that voted more heavily for Leave in the 2016 referendum. The PNS is designed, among other things, to remove this unrepresentative character.
However, there are a number of key challenges that make it particularly difficult to calculate a PNS for this year’s elections. In this blog we outline those challenges and explain how we are addressing them.
In recent years, the PNS has been calculated as follows. First, we model the change in party support in a sample of ‘key’ wards that have been contested by all of the Conservatives, Labour and the Liberal Democrats in the current year and in a previous baseline year. This modelling generates an estimate of the change in party support for every local authority, both those with and those without an election, that takes into account the variation in party performance in the local elections and the political character of each local authority. These estimates are then aggregated across all authorities to produce an estimated nationwide change in each party’s support. This estimated change is then applied to PNS for the previous baseline year to generate an estimate for the current year.
This calculation is typically made separately for numerous previous baseline years, producing a range of estimates that may vary to some degree. The final PNS is an average of the various estimates. This approach reduces the risk that the calculation is unduly influenced by possible error or distortion in the PNS estimate for a particular baseline year.
But what of this year? The most important challenge to our approach hitherto arises as a result of the performance of Reform and Greens at the last general election and their subsequent continuing popularity in the polls. Hitherto, the PNS has typically only estimated the performance of the Conservatives, Labour, and the Liberal Democrats. All the remaining parties have been lumped together in an ‘Other’ group. Apart from their traditional collective dominance of British politics, these three were historically the only parties that both fought local elections on a widespread basis and which fought all or nearly all the parliamentary seats in a general election. Thus, in the hypothetical ‘as if’ general election whose outcome the PNS attempts to estimate, we have anticipated that those three parties would fight every seat, but that this would not necessarily be case for other parties. Although we might estimate what proportion of the Other tally is accounted for by, for example, the Greens, that proportion depended on how many wards the Greens contested as well as their performance within those wards.
However, the continuing popularity of the Greens and Reform means that this year the BBC, rightly, require a PNS estimate for those two parties as well. Meanwhile, both fought most of the seats in last year’s general election – and it seems likely that they will endeavour to do so again next time around. Consequently, in contrast to previous years, our estimate will be based on the assumption that they do.
That though leads directly to another problem. Reform barely contested the elections in 2021. That means that whatever share of the vote the party secures this time around will represent an improvement on zero. We thus cannot analyse and model the change in Reform’s share of the vote in the way that we do that of other parties. And even in the case of the Greens the number of wards they fought this time and in previous years is more limited than in the case of the Conservatives, Labour and the Liberal Democrats.
Consequently, our modelling will this year focus again on wards fought by Conservative, Labour and the Liberal Democrats. In practice these will also all be wards in which Reform are present this year, while in around three-quarters the Greens will also be. Our model will produce an initial estimate for the Conservatives, Labour and the Liberal Democrats and of the collective performance of all others including Reform and the Greens. Then, at a second stage, we will determine what proportion of the other vote was won by the Greens and Reform in those wards that both parties contested in 2025 (thereby meeting our requirement that our estimate reflects what might happen if both parties contested all parliamentary seats).
Meanwhile, there is another key challenge – a paucity of baseline years that can be used in the calculation. This year’s elections are for county councils and county unitary councils plus one metropolitan district (Doncaster). In each case, all the seats were last contested in 2021 and before that in 2017. Although there were elections in 2022, 2023, and 2024 in some of the places that are electing a county councillor this year, the boundaries of the wards (known as county electoral divisions) used in county council elections are different from those used in district council elections. This makes it impossible to calculate and model at the ward level any change in support since those years. The only baseline years that can be used in the modelling are 2021 and 2017.
At the same time, of the 23 councils with elections this year, new ward boundaries are being introduced in eleven. That means it is impossible in those councils even to compare the ward level results directly with what happened in 2021. There are only just over 800 wards, clustered in a limited number of councils, where it is possible to calculate at the ward level the changes in party support since four years ago. That number is even smaller if we use 2017 as a baseline year, as new boundaries were introduced in another two councils in 2021. (Meanwhile, not a single council with elections this year still has the same ward boundaries as in 2013.)
Typically, the PNS is calculated on the basis of the ward level results in a selected sample of up to 50 councils. This year, however, the selection has effectively been made for us – the calculation will be based (with both 2017 and 2021 as a baseline) on the outcome in all the wards with unchanged boundaries, limited as they are.
That said, there is also an opportunity this year to approach the task of estimating the PNS somewhat differently. Last year’s general election saw the introduction of new parliamentary boundaries. This has improved the alignment between the wards currently in use in local council elections and the boundaries of parliamentary seats – and thus opened up some opportunities to compare the results of local elections with those of last year’s election in individual parliamentary seats – or combinations thereof.
Not that this is in any sense straightforward this year. In areas with a county and a district council the building blocks for creating parliamentary seats are district wards, not county electoral divisions. So in many counties the boundaries being used this year do not match – unless the boundaries of a parliamentary constituency coincide with those of a district council (the boundaries of which are always respected in drawing up county electoral divisions). Still, in those counties which are unitary councils the building blocks for creating parliamentary seats are the wards used in this year’s elections – though only where new ward boundaries are not being introduced. That said, the most recent parliamentary boundary review pays less respect to county or unitary boundaries than previously, so in some instances only part of a constituency has a local election this year.
In the event there are 15 constituencies where the ward boundaries being used this year match those of parliamentary constituencies. That said, in some instances a significant proportion of the component wards are not being contested this year by one or more parties, thereby limiting the utility of the comparison with what happened last year. However, there are also four areas where the boundaries of the council as a whole match those of a collection of parliamentary constituencies, while the same is also true of two of the mayoral contests. This affords another opportunity to calculate change in party support since last year.
Limited though this set of possible comparisons is, it can be used to calculate and model the change in support for all five parties for which an estimate is needed this year, and to do so using the (known) outcome of the 2024 general election as the baseline. Doing so will provide us with another set of estimates that can be included in determining the final PNS – though only once all the results of the component wards have been declared.
Indeed, with most of the local council results being declared on Friday, do not stay up overnight in the hope of hearing the PNS. It will not be available until well into Friday afternoon. And while the current state of the polls means there is particularly intense interest in the message from the local ballot boxes this year, it should by now be clear that discerning that message will be far from easy. Any estimate of the party’s performances, including the PNS, will, in truth, be accompanied by more than the usual degree of uncertainty.
John Curtice is Professor of Politics at the University of Strathclyde.
Stephen Fisher is Professor of Political Sociology at the University of Oxford.
Explanations of the PNS methodologies in previous years can be found at ElectionsEtc.com, for 2024, 2023, 2022, 2021,2019, 2018, and earlier years.
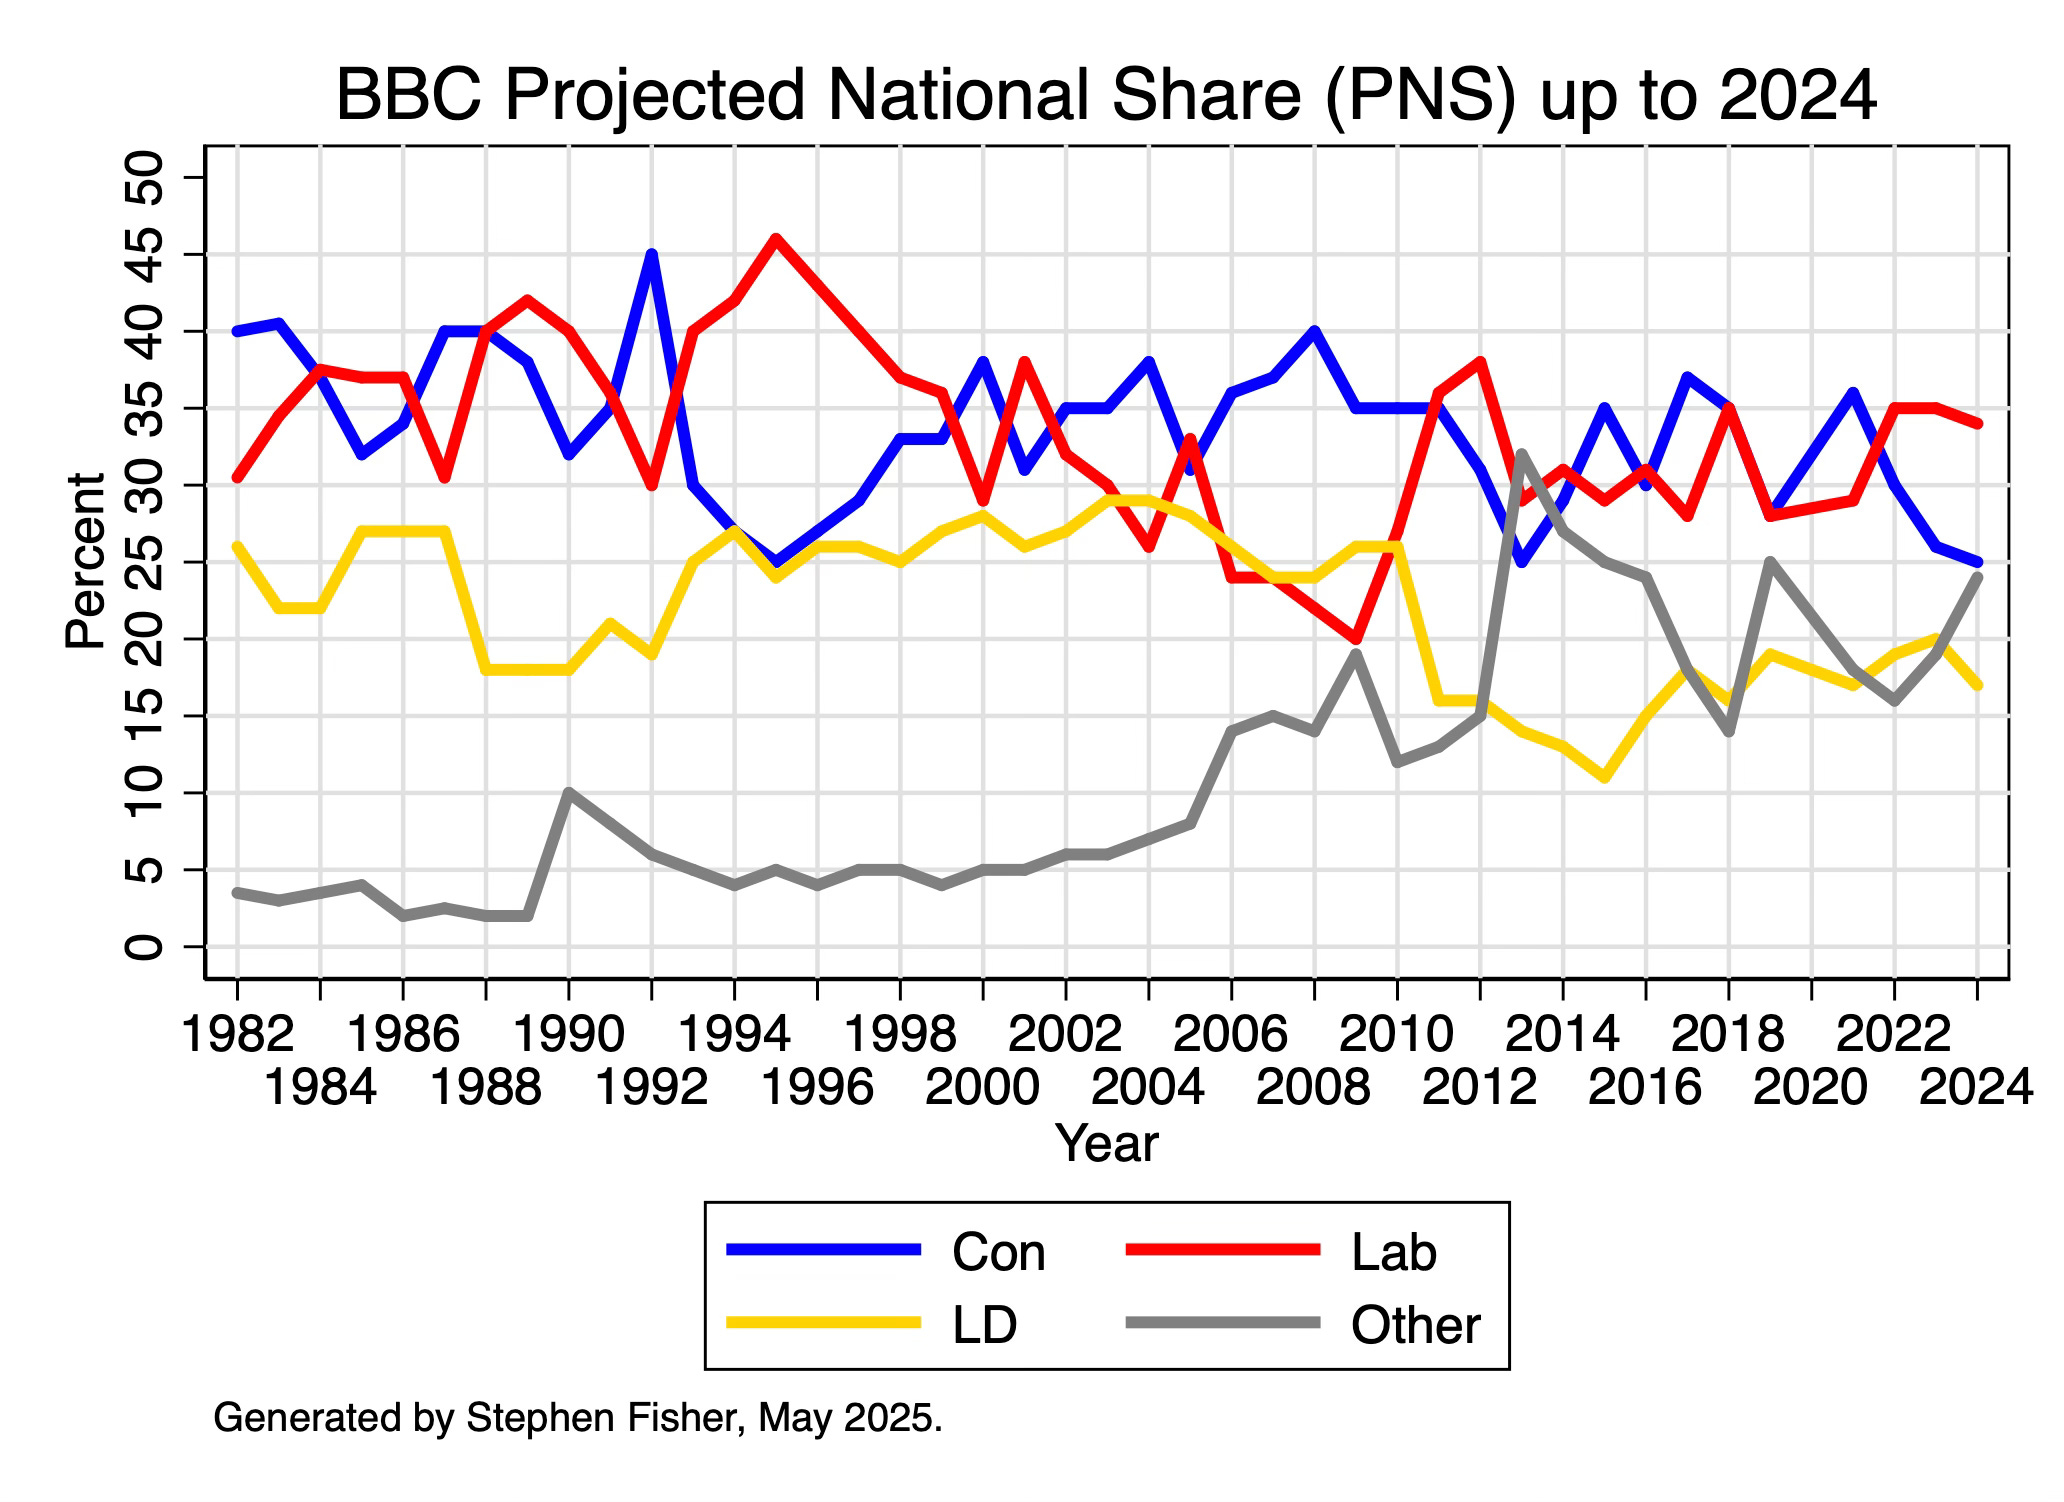
BBC Projected National Share (PNS) figures
Con Lab LD Other
1982 40 30.5 26 3.5
1983 40.5 34.5 22 3
1984 37 37.5 22 3.5
1985 32 37 27 4
1986 34 37 27 2
1987 40 30.5 27 2.5
1988 40 40 18 2
1989 38 42 18 2
1990 32 40 18 10
1991 35 36 21 8
1992 45 30 19 6
1993 30 40 25 5
1994 27 42 27 4
1995 25 46 24 5
1996 27 43 26 4
1997 29 40 26 5
1998 33 37 25 5
1999 33 36 27 4
2000 38 29 28 5
2001 31 38 26 5
2002 35 32 27 6
2003 35 30 29 6
2004 38 26 29 7
2005 31 33 28 8
2006 36 24 26 14
2007 37 24 24 15
2008 40 22 24 14
2009 35 20 26 19
2010 35 27 26 12
2011 35 36 16 13
2012 31 38 16 15
2013 25 29 14 32
2014 29 31 13 27
2015 35 29 11 25
2016 30 31 15 24
2017 37 28 18 17
2018 35 35 16 14
2019 28 28 19 25
2020 . . . .
2021 36 29 17 18
2022 30 35 19 16
2023 26 35 20 19
2024 25 34 17 24